
Generate Exactly the Reports Your Institution, Funders, and Regulators Require
Standard reports never match what you actually need to submit. Manually compiling data from experiments into required formats wastes hours every month. Custom reports and analytics services build exactly the reports, dashboards, and visualizations your specific stakeholders require. Stop reformatting data and start generating compliant, publication-ready reports automatically.


Custom Reporting Solutions That Eliminate Manual Data Compilation
How many hours do you spend each month copying experimental data into grant reports, institutional forms, or regulatory submissions? Every organization has specific reporting requirements that don't match standard software outputs. Custom reports and analytics services solve this by building exactly what you need. Grant progress reports with your funder's specific format. Compliance documentation matching regulatory templates. Publication-ready figures styled for your target journals. Interactive dashboards tracking KPIs your institution actually cares about. We build it all.
Our reporting solutions leverage the LabVista's powerful analytics platform to create custom reports that pull data automatically from your experiments, apply your specific calculations and formatting, and generate outputs in required formats. Reports can run on demand, on schedule, or triggered by specific conditions. We don't just design reports once. We iterate based on your feedback, ensure outputs match requirements exactly, and provide training so your team can generate reports independently. Complex analytics that currently require manual spreadsheet work become one-click automated reports.
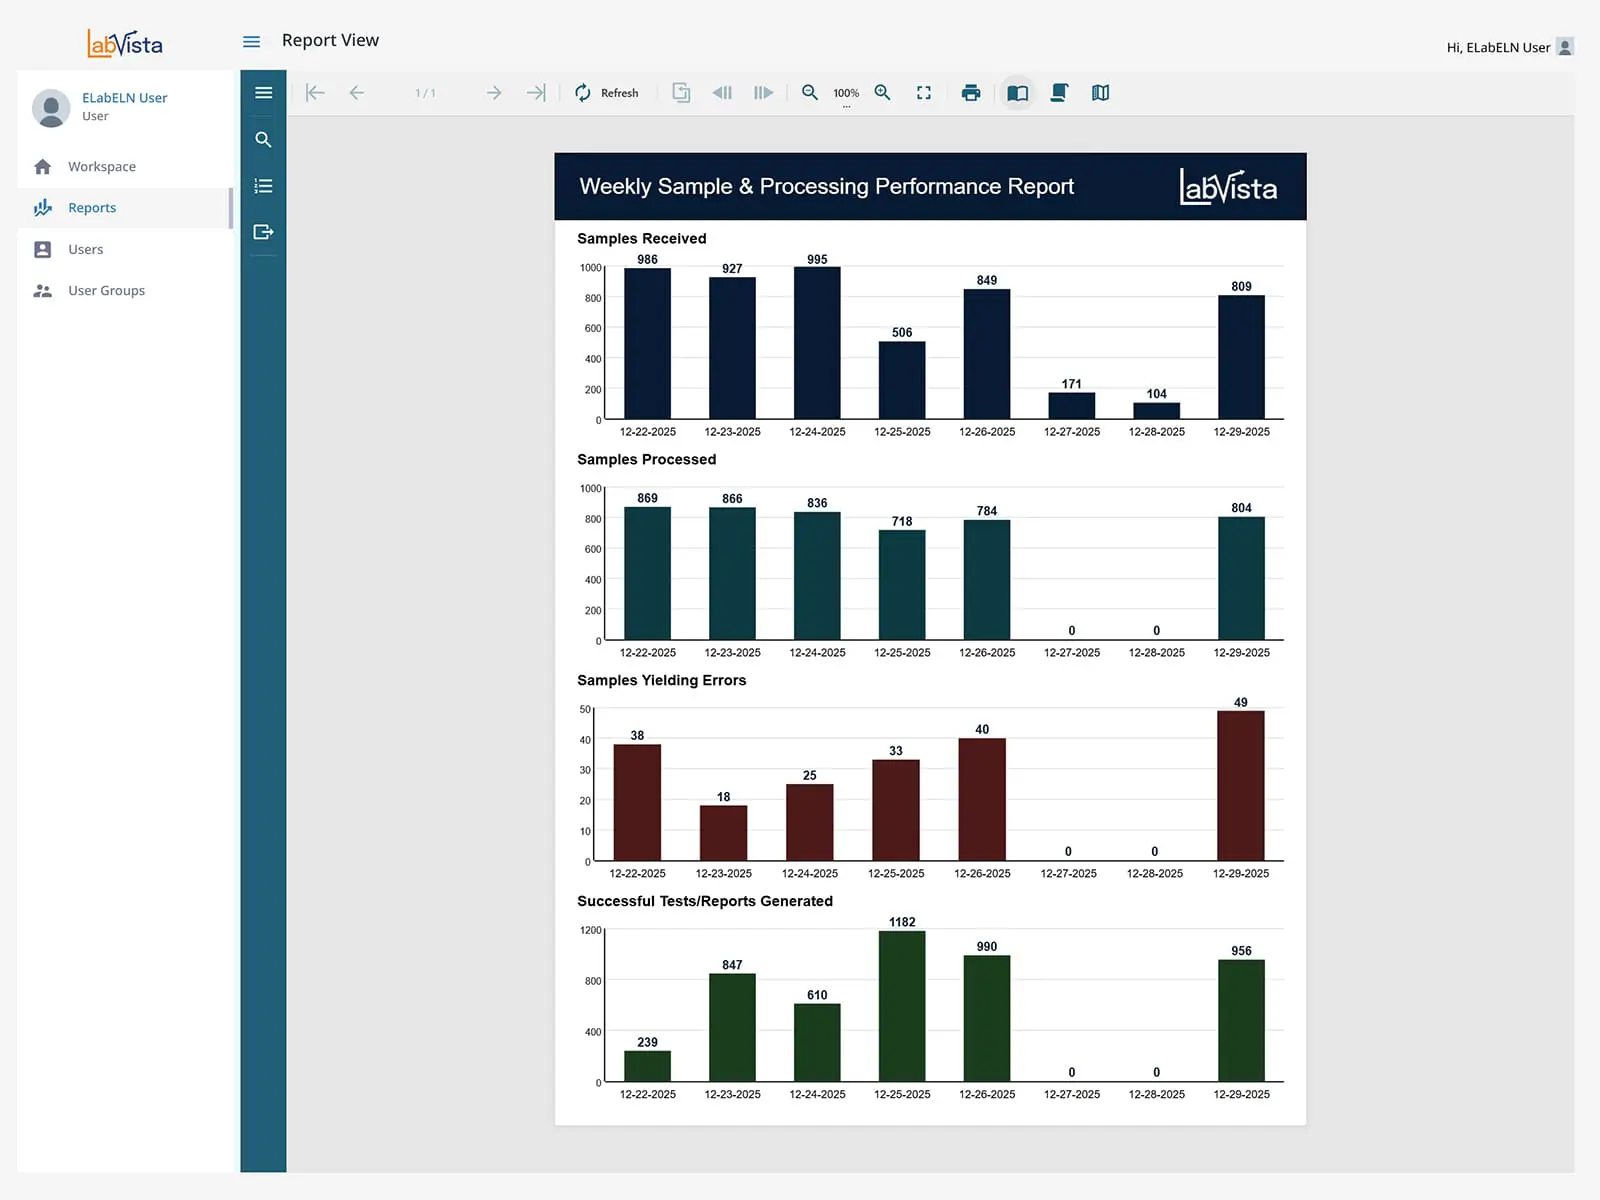
Stop spending research time on manual report compilation. See how custom reports automate what you actually need to submit.
Complete Custom Reporting and Analytics Services for Every Requirement
Our custom reporting services cover everything from simple formatted exports to sophisticated interactive dashboards with real-time analytics. Whether you need compliance reports matching regulatory templates, publication-ready figures, or custom visualizations analyzing trends across years of research, we build reporting solutions that transform raw experimental data into exactly what your stakeholders require.
Custom Report Design and Development
Institutional Report Templates
Build reports matching your institution's exact format requirements. Grant progress reports, institutional review documents, or administrative submissions with proper formatting, calculations, and data automatically populated.
Regulatory Compliance Reports
Create reports satisfying specific regulatory requirements. FDA submissions, GLP/GMP documentation, or industry-specific compliance reports with complete audit trails and electronic signature documentation.
Publication-Ready Figure Generation
Design automated figure generation for manuscripts. Publication-quality visualizations styled for specific journals, properly formatted with legends and annotations, exported in required formats and resolutions.
Interactive Dashboards and Visualizations
Custom KPI Dashboards
Build interactive dashboards tracking metrics important to your lab or institution. Real-time visualization of productivity, resource utilization, project progress, or any KPIs stakeholders need to monitor.
Advanced Data Visualization Tools
Create sophisticated visualizations beyond standard charts. Heat maps, network diagrams, statistical plots, or specialized representations that communicate your specific data types effectively.
Dynamic Filtering and Drill-Down
Design interactive reports where users filter, sort, and drill into data dynamically. Explore results by project, timeframe, researcher, or any dimension without creating separate static reports.
Automated Analytics and Insights
Custom Calculation Engines
Build reporting logic with your exact formulas, statistical methods, and business rules. Ensure calculations match institutional requirements, regulatory expectations, or publication standards precisely.
Trend Analysis and Predictions
Develop reports analyzing trends across experiments over time. Identify patterns, predict outcomes, or highlight anomalies using statistical analysis or machine learning applied to your research history.
Cross-Experiment Analysis Reports
Create reports aggregating data from multiple experiments, projects, or research groups. Meta-analysis, comparative studies, or comprehensive summaries spanning your complete research portfolio.
Report Automation and Distribution
Scheduled Report Generation
Set up reports that generate automatically on schedules. Weekly productivity summaries, monthly compliance reports, or quarterly grant updates delivered without manual intervention.
Automated Report Distribution
Configure automatic email delivery of reports to stakeholders. Send reports to specific recipients on schedule or when conditions are met with proper permissions and access controls.
Multi-Format Export Options
Generate reports in any required format. PDF for submissions, Excel for further analysis, Word for editing, PowerPoint for presentations, or custom formats matching specific submission systems.
Start with Standard Reporting, Scale to Advanced Analytics
"*" indicates required fields